UPDATE: 530A (Trump) Account auto-enrollment announced. Explore the Partner Toolkit to help families take action.
More about More
37% chart
37% chart
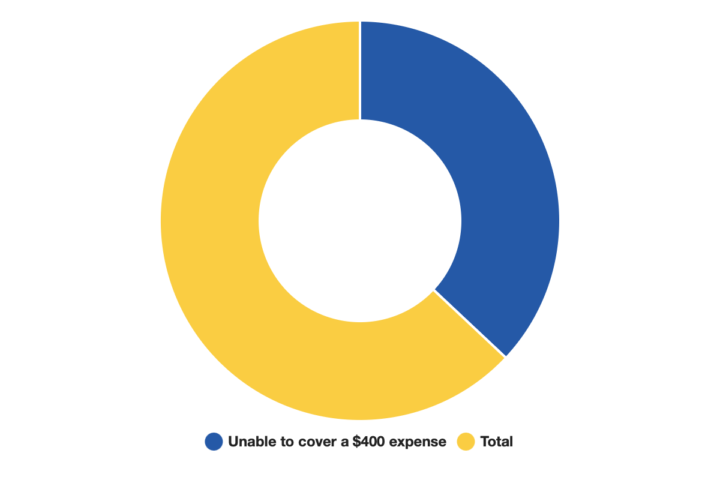
Doughnut chart. Data table with 2 rows and 2 columns follows.
37% chart
Unable to cover a $400 expense
37%
Total
63%
We use cookies on our site to improve the browsing experience. You can manage this via your browser settings at any time. To learn more about how we use cookies, please see our Privacy Policy.